Human Microbiome Profiling Services
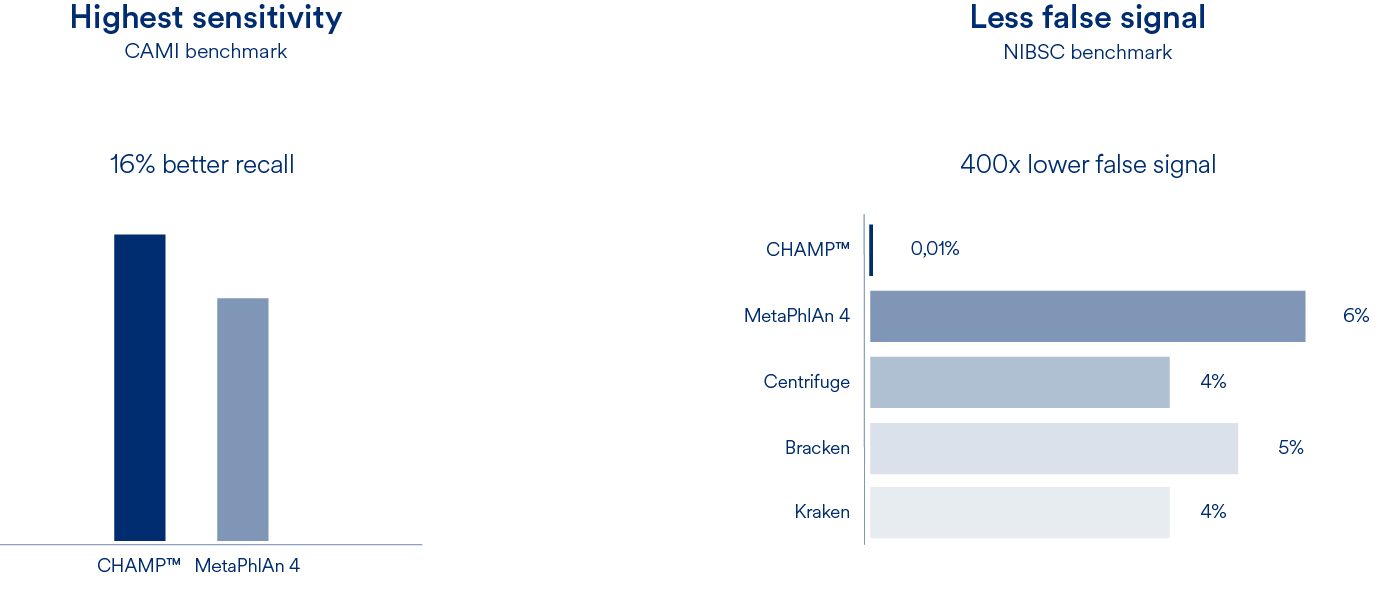
Profiling of metagenomics data is the foundation of all microbiome research. Our Cmbio human microbiome profiler (CHAMP™) provides the most comprehensive, precise and sensitive profiling for the human microbiome. With 6809 species, a recall that is 16% better than competing methods and a false abundance call (FPRA) that is at least 400 times better than any other method, CHAMP™ has no equal.
Our Microbiome Profiling Services include:
Functional Microbiome Analysis
Phage Profiling
Kepler™ - Host-Agnostic Profiling
Antimicrobial Resistance Profiling
Microbiome Profiling
Profiling of metagenomics data is the foundation of all microbiome research. Our Cmbio human microbiome profiler (CHAMP™) provides the most comprehensive, precise and sensitive profiling for the human microbiome. With 6809 species, a recall that is 16% better than competing methods and a false abundance call (FPRA) that is at least 400 times better than any other method, CHAMP™ has no equal.
Why Choose Cmbio for Your Microbiome Profiling Needs?
-
Industry-leading taxonomic precision and low-abundance detection
-
Comprehensive, host-agnostic solutions for diverse sample types
-
Advanced functional and virome analysis for actionable insights
-
Proven benchmarking against industry standards
-
End-to-end services or standalone data analysis options
Get in Touch or Download Our CHAMP™ Poster
Introducing CHAMP™ - Human Microbiome Profiler
With CHAMP™, we offer high-resolution taxonomic and functional profiling that is unparalleled in accuracy, precision, and coverage to maximise insights from your study. CHAMP™ employs over 400,000 metagenome-assembled genomes (MAGs), derived from more than 30,000 microbiome samples sourced from 9 distinct human body sites-including gut, vagina, skin, and mouth.
This extensive dataset includes nearly 7,000 bacteria, archaea, and human-relevant eukaryotic species, many newly discovered, forming the basis of our microbiome analysis services.

Compared to MetaPhlAn4, CHAMP™ showed 16% greater sensitivity (recall) across different human body sites and showed an astounding 400 times lower false signal in the NIBSC mock community benchmark compared to state-of-the-art profilers (MetaPhlAn4, Centrifuge, Kraken, and Bracken). This means that when CHAMP™ detects something, you can trust that it is there.
CHAMP™ is available as part of our end-to-end human microbiome research services or as a standalone service for profiling or re-profiling of shotgun sequencing data.
Request a Proposal or Download White Paper to see how CHAMP™ can advance your microbiome research
Functional Microbiome Analysis: Beyond Taxonomy
Our Functional Profiling Services
We offer comprehensive functional profiling using advanced sequencing technologies and resources such as:
- Kyoto Encyclopedia of Genes and Genomes (KEGG) for metabolic pathway mapping
- Gut Metabolic Modules
- Gut-Brain Modules
- Bile Acid Metabolism
- Human Milk Oligosaccharide (HMO) Metabolism
- Antimicrobial Resistance Genes (CARD)
- Virulence Factors
Our data analysis approach decodes the functional capabilities of microbial communities, illuminating their roles in health and disease.
Functional Species Groups (FSG) & Redundancy Detection
Understanding Functional Redundancy
Different microbial species can occupy the same functional niche in various hosts—a phenomenon known as functional redundancy. Through our Functional Species Group (FSG) tool, we group species that share similar functional potentials regarding metabolic pathways, enzymatic activities, or disease associations. For example, species encoding the molecular pathway for butyrate production via transferase are grouped together.
Enrichment Testing for Functional Associations
Sometimes, a group of functionally related species may be associated with a treatment or condition, even if none of the individual species show significant abundance changes on their own. Our FSG enrichment tests can identify such associations by statistically evaluating whether multiple species within the same FSG collectively have a stronger link to a treatment group.
The power of this approach lies in its ability to identify functional enrichment even when there is no significant change at the species or strain level—pinpointing critical functions or pathways relevant to specific phenotypes or treatments.
We continually expand our FSG sets based on the latest scientific developments and our clients' interests. Functional analysis and FSG enrichment serve as natural extensions of taxonomic analysis, bringing you closer to understanding the mechanisms linking the microbiome to phenotypes, diseases, and treatment responses.
Applications of Functional Profiling in Microbiome Research
By including functional microbiome analysis in your study, you can:
- Identify Potential Biomarkers
-
Disease Diagnosis and Progression: Discover functional biomarkers associated with specific phenotypes or disease states.
-
Machine Learning Integration: Use functional profiles as input for machine learning models to enhance predictive accuracy.
-
- Understand Microbiome Adaptation
-
Environmental Responses: Explore how microbial communities adapt to environmental changes like toxin exposure, antibiotic use, or dietary shifts.
-
Mechanistic Insights: Gain a deeper understanding of microbial resilience and adaptation mechanisms.
-
- Inform Treatment Development
-
Mechanistic Understanding: Increase knowledge of how microbial functions impact health conditions, guiding the development of new treatments.
-
Actionable Hypotheses: Generate testable hypotheses for follow-up in vivo or in vitro studies.
-
Multi-Omics Integration: Combine functional analysis with other omics data (genomics, metabolomics) for a holistic view.
-
Illustration of the Functional Species Group (FSG) concept. Species 1, 2, and 3 all share functional potential associated with KEGG module X. Collectively, these three microbial species (MGSs) form Functional Species Group X. Individually, each species exhibits a weak association with the clinical parameter shown at the top (in this case, Body Mass Index [BMI]), and none shows a statistically significant signal on its own. However, because these species occupy the same functional niche across different hosts, evaluating them together as an FSG reveals a strong association between the functional module X and the clinical parameter. This approach demonstrates how aggregating species based on shared functional potential can uncover significant functional enrichments linked to phenotypes or treatments that might be missed when analyzing species individually.
Request a Proposal to discuss how functional profiling can enhance your research
Phage and Virome Profiling
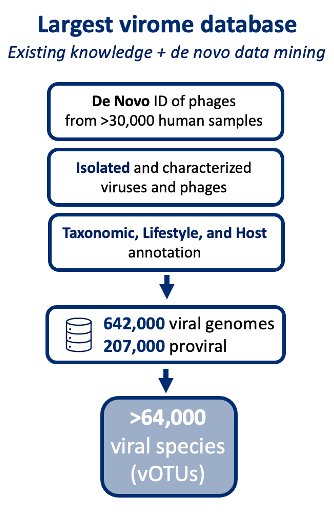
Insights into viral taxonomy and phage-host dynamics are critical for developing microbiota-based therapeutics. Our CHAMP™ virus profiling leverages the largest commercial virome database, with over 800,000 viral sequences from 64,000 virus species (vOTUs), offering unmatched comprehensiveness in microbiome analysis.
Comprehensive Virus Database and Phage-Host Mapping
Our curated virus database includes bacteriophages and de novo-identified phages from over 30,000 human microbiome samples. CHAMP™ enables annotation of phage lifestyles (lytic vs. lysogenic), tracks over 14,000 virulent and 12,700 temperate phage species, and maps phage-host relationships down to genus level for more than 55% of tailed bacteriophages.
Advanced phage profiling supports applications in probiotic and live biotherapeutic product (LBP) development, elucidating engraftment outcomes, and guiding next-generation therapeutic strategies.

Increased Profiling Fidelity with CHAMP™
Paired with the industry-leading precision of the CHAMP™ Human Microbiome Profiler, benchmarking analyses show that the incidence of false positives is minimized while more viral species are detected, thereby exceeding metrics compared to competing tools [1]
Advanced Insights across Applications
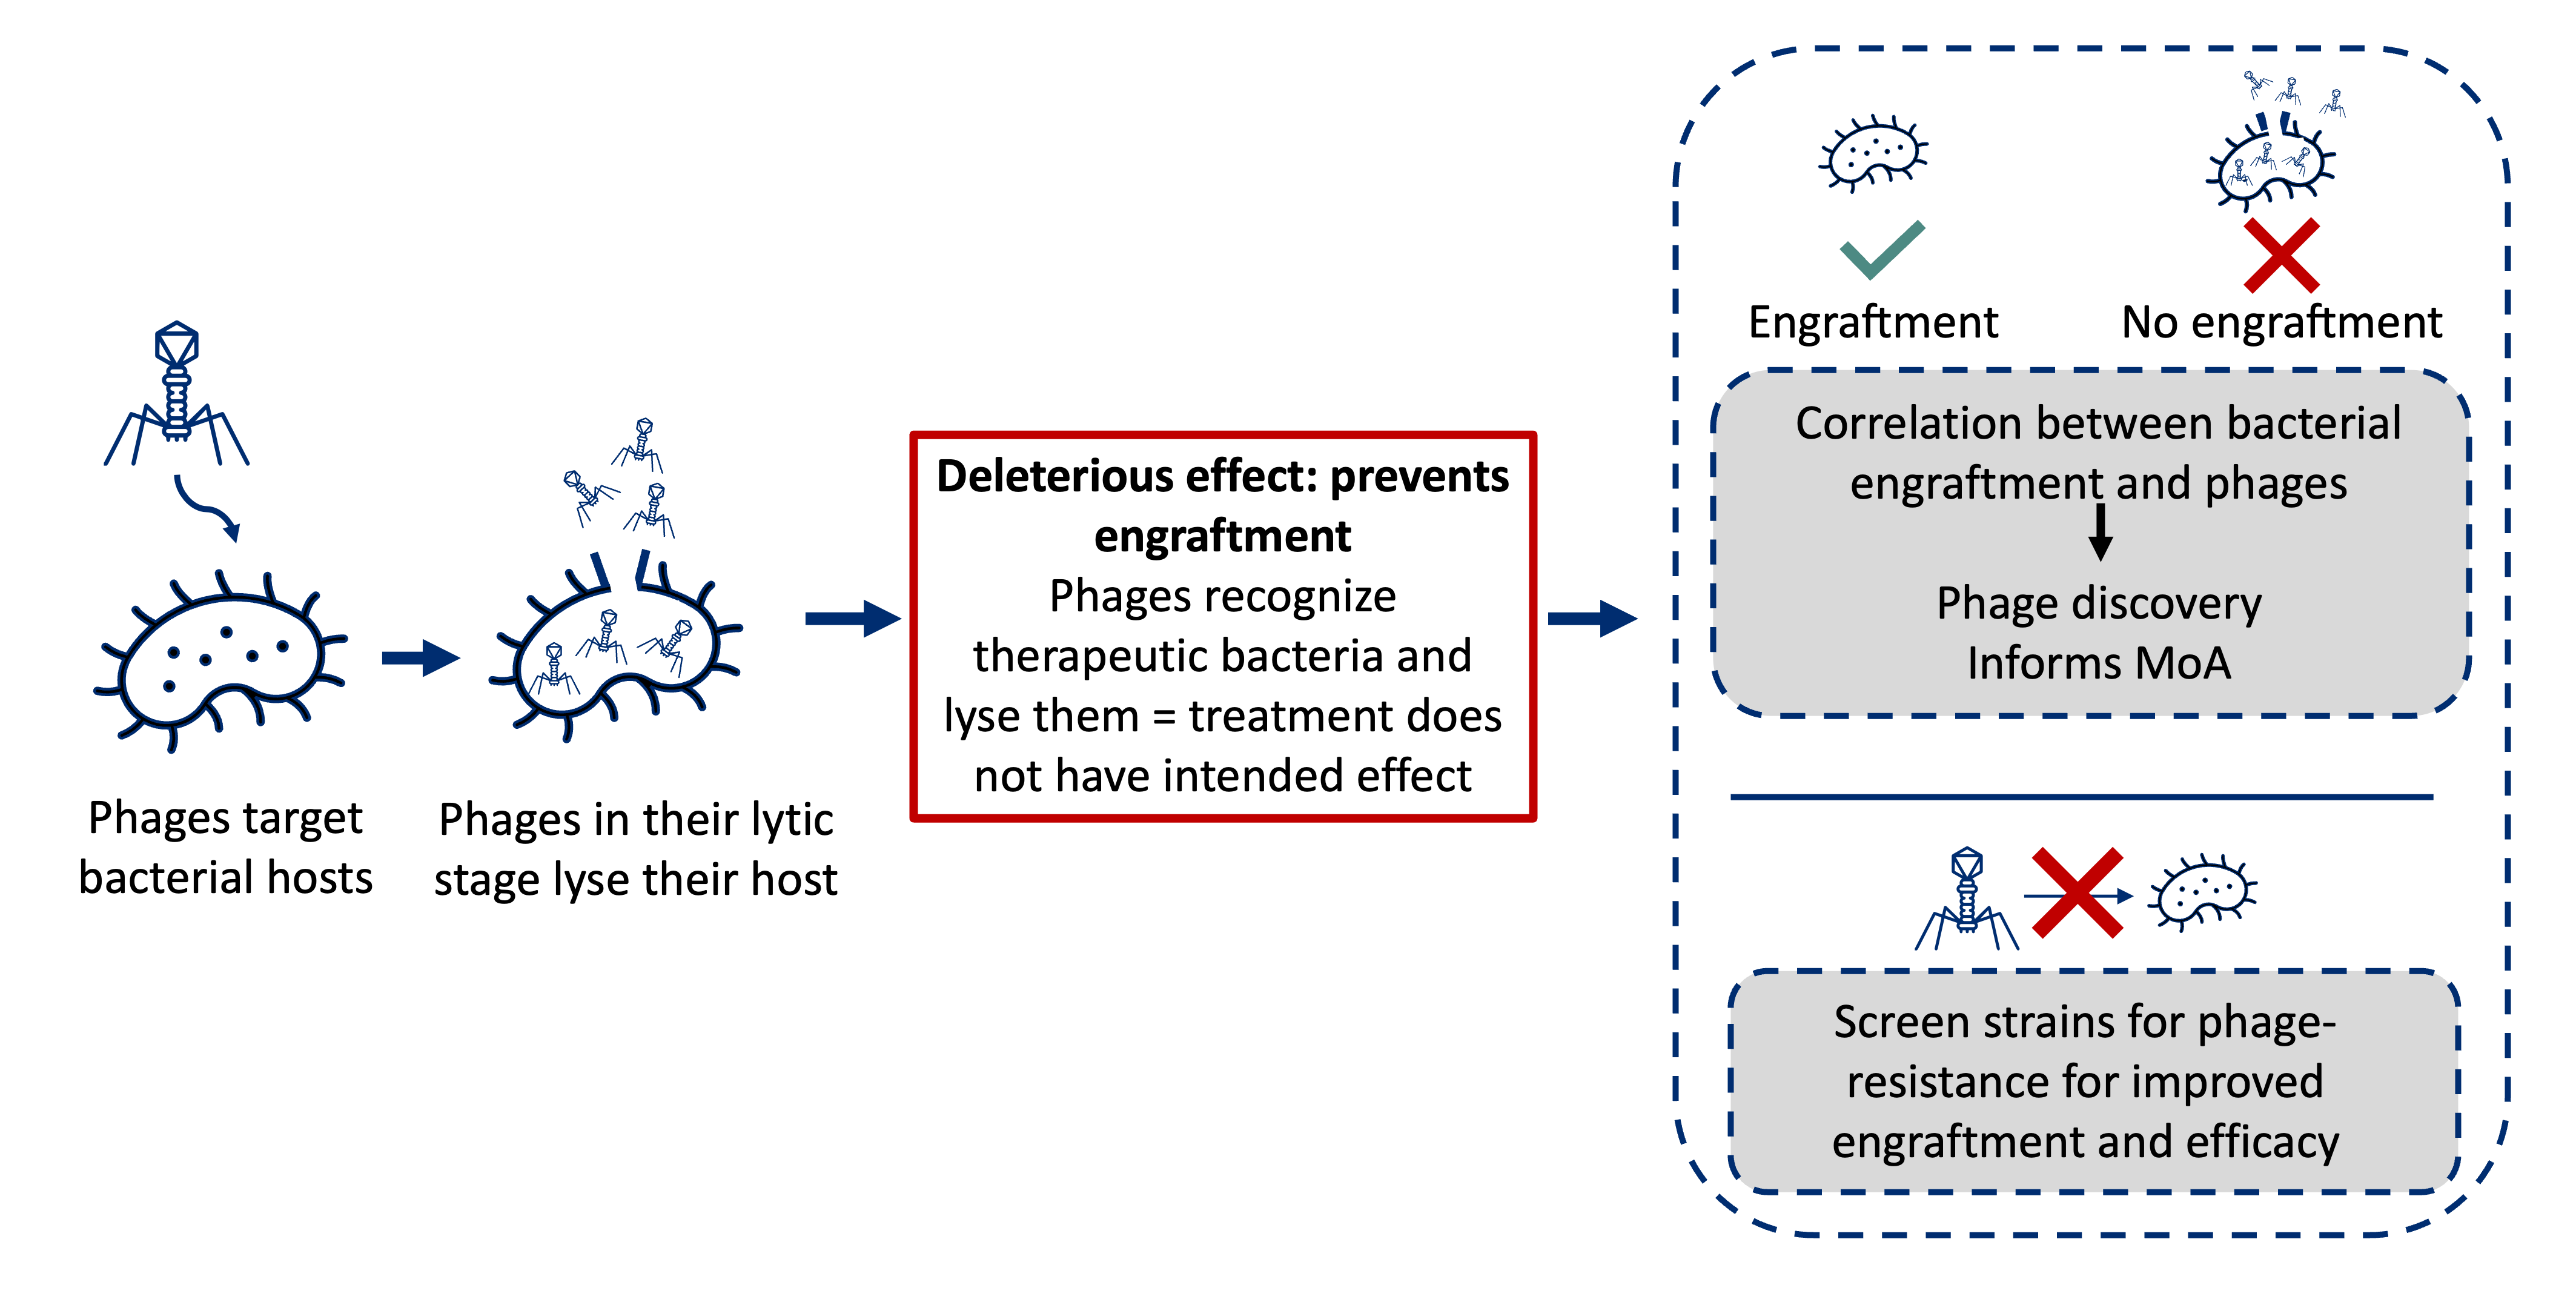
In probiotic or LBP development, mapping phage-host relationships can explain different engraftment outcomes among patient populations.

For example, in figure A below, a lean phenotype is not only driven by the presence of certain gut bacteria in the mouse. A fecal viral transplant (FVT) from a lean mouse to an obese mouse shows the different phenotype outcomes after FVT based on the presence of possible phages (either red or orange) in the lean donor. If the orange phages are transferred, it has no effect on the obese phenotype. In this scenario, there is no matched host for the orange phages, or endogenous bacteria in the obese mouse are resistant to phage attack. A lean phenotype results from the transfer of red phages who find and lyse their bacterial host, thus shaping the bacterial structure toward the lean phenotype.
Figure B shows a similar concept where the blue phages recognize an LBP intervention and lyse it, preventing engraftment in the gut. The orange phages recognize the LBP, but some of the bacterial strains have endogenous phage resistance resulting in some engraftment. In the red scenario, phages either do not find a suitable bacterial host or the bacteria hosts are present but are resistant to the phages. The red LBP shows strong engraftment.
Profiling and identification of such mechanisms can be used to engineer next-generation microbiome-based therapeutics with phage resistance and enhanced efficacy. This approach can also be used to enhance discovery pipelines by linking phage characteristics directly to specific phenotypes or health outcomes.
Created with BioRender.com
For the phage therapeutic developer, phage profiling offers a discovery tool for phages capable of remodelling bacteriome structures to reverse disease phenotypes and target pathobionts [2, 3]. Additionally, it can be used as a precision tool to identify a range of phage candidate(s) with specific host range that target only the intended bacteria. This focused strategy enhances the safety and efficacy of phage therapies and provides a funnel approach for enabling the development of highly specialized treatments that address bacterial infections without disrupting the beneficial microbiota.
Recently, phage analysis has been used to understand novel metabolic interactions in populations that are more resistant to aging due to enhanced mucosal integrity and resistance to pathobionts. [4] Bacteriophage are at the forefront of the fight against antimicrobial resistance (AMR) due to their ability to effectively disrupt AMR motifs and kill bacterial hosts [5]. These functions have unveiled a new toolbox for controlling infection [6].
Request a Proposal to explore phage profiling for your study
Host-Agnostic Microbiome Profiling with Kepler™
To complement our Human Profiler, CHAMP™, Kepler™ uses a host-agnostic curated database to process samples beyond the human host including but not limited to environmental, animal, soil, food samples and many others.
Kepler maximizes the value derived from metagenomic data by blending the precision of K-mer exact-matching with the adaptability of probabilistic alignment. It accomplishes this by utilizing a curated, host-agnostic database of signature k-mers mapped across 30,000 species organized in a phylogenetic tree-like structure.
How Kepler™ Works: A 3-Step Approach
- Curated Database of Microbial Genomes: High completeness, low contamination, and intra-species diversity ensure optimal taxonomic signal-to-noise for complex microbial communities.
- Identifying Signature Features: Pre-computation of k-mers enables precise taxonomic classification via a phylogenetic tree-like structure.
- Taxonomy Database Search: Sequencing reads are compared using both k-mer sets and probabilistic algorithms for sensitive and accurate classification.
Benchmarking Against Industry Standards
Benchmarking Kepler against leading profilers such as Kraken2/Bracken and MetaPhlAn4 using real-world community standards demonstrated its superiority.
With exceptional F1-Scores, Kepler excels in detecting low-abundance taxa and differentiating closely related species, showcasing its precision even at the sub-species level.
Download White Paper for detailed benchmarking data
References
[1] Pinto Y, Chakraborty M, Jain N, Bhatt AS. Phage-inclusive profiling of human gut microbiomes with Phanta. Nat Biotechnol. 2023 May 25. doi: 10.1038/s41587-023-01799-4. PMID: 37231259.
[2] Rasmussen TS, Mentzel CMJ, Kot W, Castro-Mejía JL, Zuffa S, Swann JR, Hansen LH, Vogensen FK, Hansen AK, Nielsen DS. Faecal virome transplantation decreases symptoms of type 2 diabetes and obesity in a murine model. Gut. 2020 Dec;69(12):2122-2130. doi: 10.1136/gutjnl-2019-320005. Epub 2020 Mar 12. PMID: 32165408.
[3] Ritz NL, Draper LA, Bastiaanssen TFS, Turkington CJR, Peterson VL, van de Wouw M, Vlckova K, Fülling C, Guzzetta KE, Burokas A, Harris H, Dalmasso M, Crispie F, Cotter PD, Shkoporov AN, Moloney GM, Dinan TG, Hill C, Cryan JF. The gut virome is associated with stress-induced changes in behaviour and immune responses in mice. Nat Microbiol. 2024 Feb;9(2):359-376. doi: 10.1038/s41564-023-01564-y. Epub 2024 Feb 5. PMID: 38316929; PMCID: PMC10847049.
[4] Johansen J, Atarashi K, Arai Y, Hirose N, Sørensen SJ, Vatanen T, Knip M, Honda K, Xavier RJ, Rasmussen S, Plichta DR. Centenarians have a diverse gut virome with the potential to modulate metabolism and promote healthy lifespan. Nat Microbiol. 2023 Jun;8(6):1064-1078. doi: 10.1038/s41564-023-01370-6. Epub 2023 May 15. PMID: 37188814.
[5] UK Parliament. The antimicrobial potential of bacteriophages. 3 January 2024. https://publications.parliament.uk/pa/cm5804/cmselect/cmsctech/328/report.html
[6] Strathdee SA, Hatfull GF, Mutalik VK, Schooley RT. Phage therapy: From biological mechanisms to future directions. Cell. 2023 Jan 5;186(1):17-31. doi: 10.1016/j.cell.2022.11.017. PMID: 36608652; PMCID: PMC9827498.
Antimicrobial Resistance Profiling
Microbial communities are heavily influenced by antibiotics and other antimicrobials. Microbiome compositions, both relative and absolute abundances, not only change, but species also respond to antibiotic treatments by acquiring and disseminating antibiotic resistance genes (ARGs).
With the CARD database and our proprietary annotation and organization of species we provide clients with a detailed resistome analysis that provides insights on antibiotic resistance genes (ARG), classes and whether the ARGs can be transferred horizontally or is comprised of species that are considered commensal, pathogenic or an opportunistic pathogen.
Our ARG Detection Methodology
We deliver resistome analysis at multiple levels:
- ARG richness and abundance
- Antibiotic class-level summaries
- Resistance threat categorisation (e.g., ESBL, carbapenem, vancomycin resistance)
- Identification of ARGs on plasmids/pathogens
These insights help pinpoint the most threatening ARGs and inform both research and clinical strategies.
Resistome Insights and Reporting
The development and spread of microbial antibiotic resistance causes previously reliable antibiotics to fail, posing serious global health concerns. Microbial communities respond to antibiotics not only by changing their composition, but also by acquiring and disseminating antibiotic resistance genes (ARGs). The resistome is the set of ARGs in a microbial community.
Antimicrobial resistance is a serious global health problem that threatens our ability to effectively treat infections and is leading to increased morbidity, mortality, and healthcare costs.
Microbial communities are heavily influenced by antibiotics. Microbiome compositions, both relative and absolute abundances, not only change, but species also respond to antibiotic treatments by acquiring and disseminating antibiotic resistance genes (ARGs). The emergence of antibiotic-resistant bacteria are rendering antimicrobial drugs ineffective in treating infections. This poses a significant threat to public health.
Developing new antibiotics to combat these challenges is a complex and arduous task. We provide clients with detailed resistome analysis to enable insights on the antimicrobial resistance associated with new or already approved antimicrobial treatments or specific diseases.
Request a Proposal to see how resistome analysis can support your study
References
¹ Alcock BP, Raphenya AR, Lau TTY, et al. CARD 2020: antibiotic resistome surveillance with the comprehensive antibiotic resistance database. Nucleic Acids Res**.** 2020 Jan 8;48(D1):D517-D525. doi: 10.1093/nar/gkz935.
Have a look at some of our published work involving resistome analyses:
Pallejá, A., Mikkelsen, K.H., Forslund, S.K. et al. Recovery of gut microbiota of healthy adults following antibiotic exposure. Nature Microbiology 3, 1255–1265 (2018). https://doi.org/10.1038/s41564-018-0257-9
Nielsen KL, Olsen MH, Pallejá A, et al. Microbiome Compositions and Resistome Levels after Antibiotic Treatment of Critically Ill Patients: An Observational Cohort Study. Microorganisms 12, 2542 (2021). doi: 10.3390/microorganisms9122542


